Case Study #6: Churn Analysis for a Multi-Location Healthcare Facility
MemorialCare, a healthcare facility with multiple locations across America, depends on stable employer relationships and member continuity. This churn analysis looks through two lenses: total churn (employers that fully left) and employers with decline (still active but shrinking). Pairing a fiscal-year view with breakdowns by month, plan, product and source shows where losses concentrate and why, and gives the client a playbook for saving at-risk accounts before small declines become full churn.
At a glance
Client: multi-location healthcare provider, United States · Industry: Healthcare · Scope: FY 2025 churn dashboard, employer and membership level
1,375
Employers churned 24.5% of the employer base, FY 2025
−4,082
Memberships lost 3.5% of total, through full churn
1,299
Employers in decline 26.3% still active but shrinking
−9,521
Memberships in decline 8.2% of total memberships
Business challenges
Losses are uneven across months, making staffing and outreach hard to time.
Some health plans and product codes are over-represented in churn, masking root causes behind labels.
Without a separate view for ‘employers with decline,’ critical warning signs can be missed until it’s too late.
Attribution is difficult: churn from broker/source, plan benefit changes, or onboarding friction can look similar.
Project objectives
Quantify total churn and declining cohorts to guide save-actions.
Surface patterns by month, health plan, product code, and acquisition source.
Prioritize accounts where small declines are likely to escalate.
Translate findings into targeted retention plays and service fixes.
Our approach
1. Data integration and definitions
We consolidated churn events and membership changes across FY 2025 and standardised the definitions: total churn (employers that fully left) and employers with decline (still active but with net membership loss). Plan names, product codes and sources were aligned, with controls to safeguard sensitive information.
2. Visual storytelling
Ten views, each answering one question a retention lead would ask. Together they move from how much was lost, to where, to which accounts to call first.
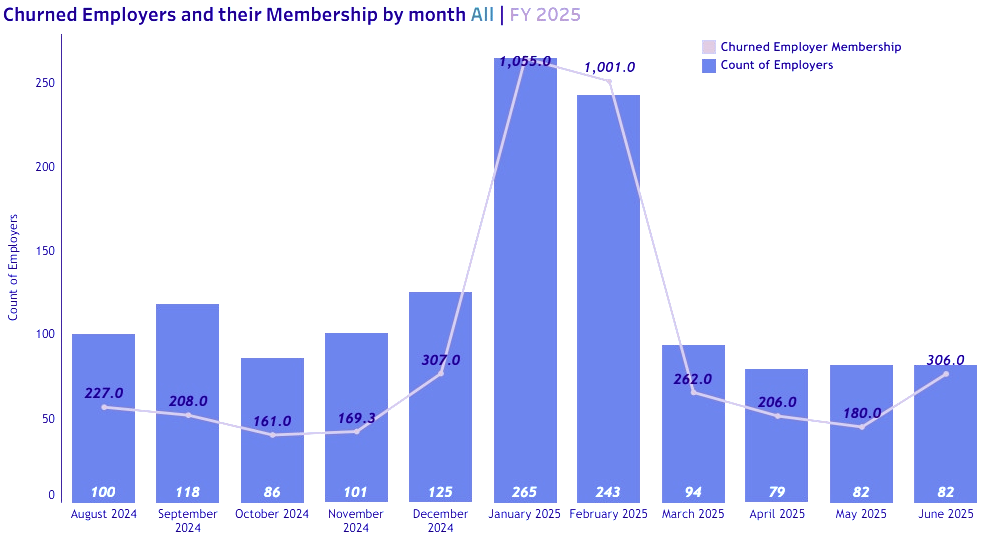
For each month, how many employers churned and the memberships they took with them. Spikes in late autumn and winter show employer count and membership loss jumping together.
Figure 1. Churned employers and the memberships they took with them, by month, FY 2025
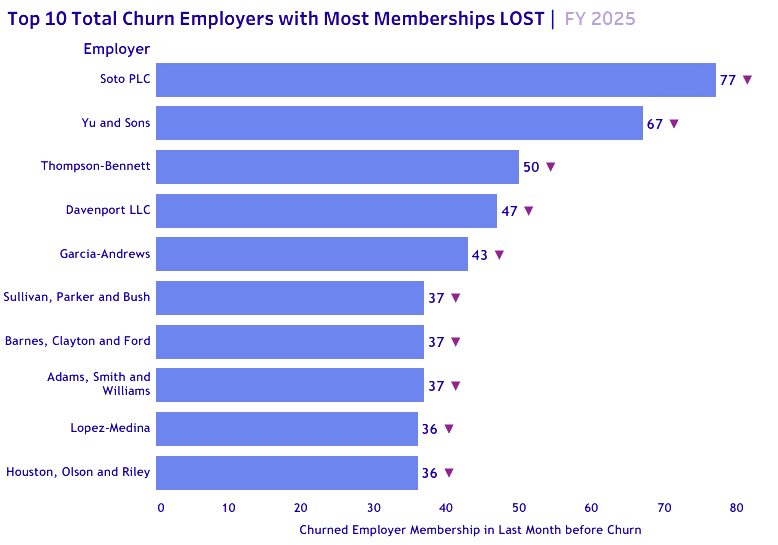
A ranked list of employers that left with the largest membership counts. Use it to review contract histories and service issues, and to set thresholds for proactive save-actions next cycle.
Figure 2. Top 10 churned employers by memberships lost, FY 2025
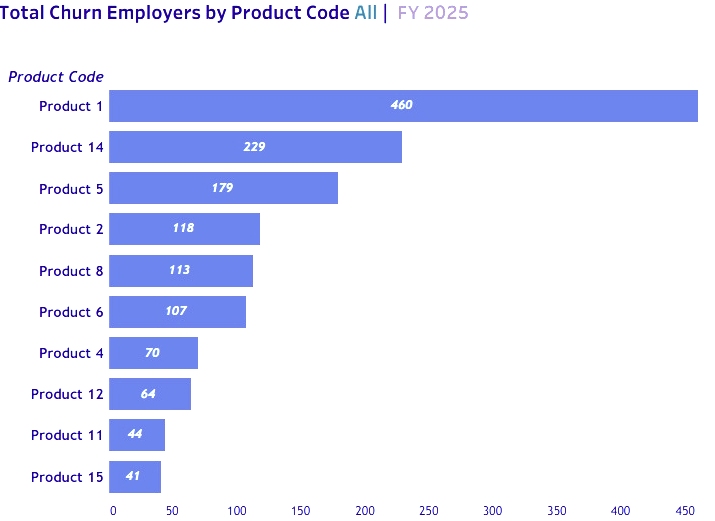
Bars show the number of churned employers by product code. Concentrations around certain codes (Product 14, Product 5) point to plan design or service alignment issues.
Figure 3. Churned employers by product code, FY 2025
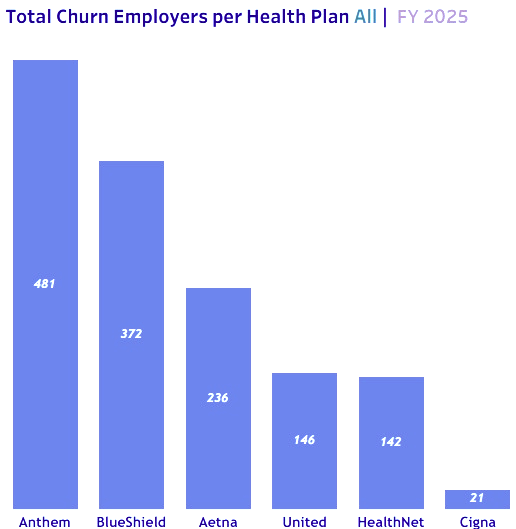
The health plans associated with churned employers. Use it to partner with plans on retention incentives and to refine benefit education where confusion may be driving exits.
Figure 4. Churned employers per health plan, FY 2025
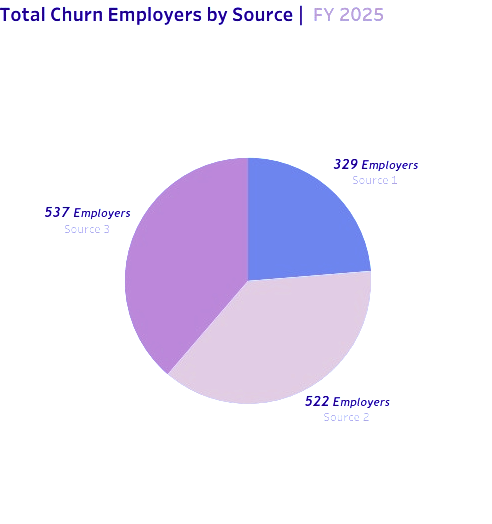
Broker and partner sources compared by employer churn counts and memberships lost. Disproportionate losses from one source justify enablement or quality reviews.
Figure 5. Total churn by broker or partner source
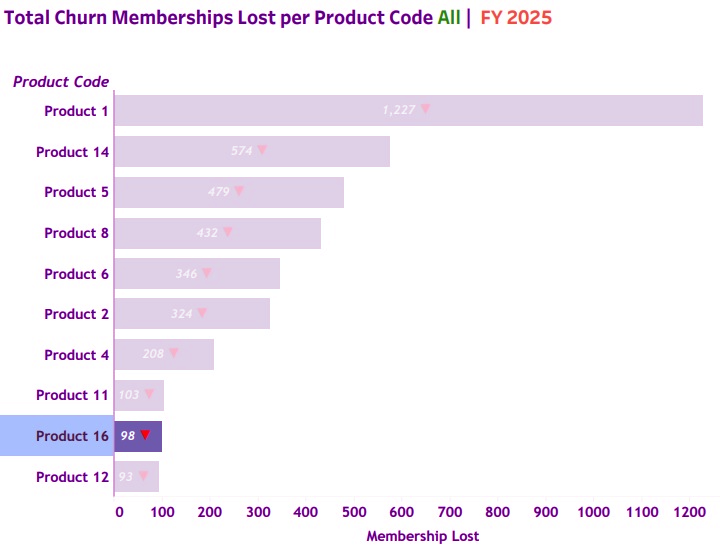
The same view shifted from employer count to member impact per product. Larger bars (Product 1) show where to prioritise fixes and concentrate renewal messaging.
Figure 6. Memberships lost to churn per product code, FY 2025
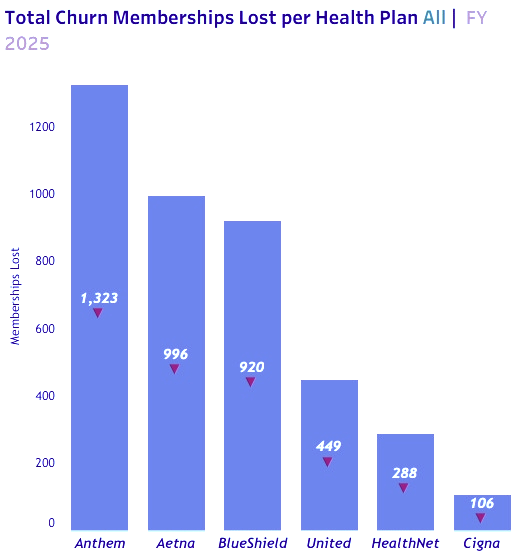
Membership loss by plan. Higher values (Anthem, Aetna, Blue Shield) call for joint action plans with payers and tailored outreach.
Figure 7. Memberships lost to churn per health plan, FY 2025
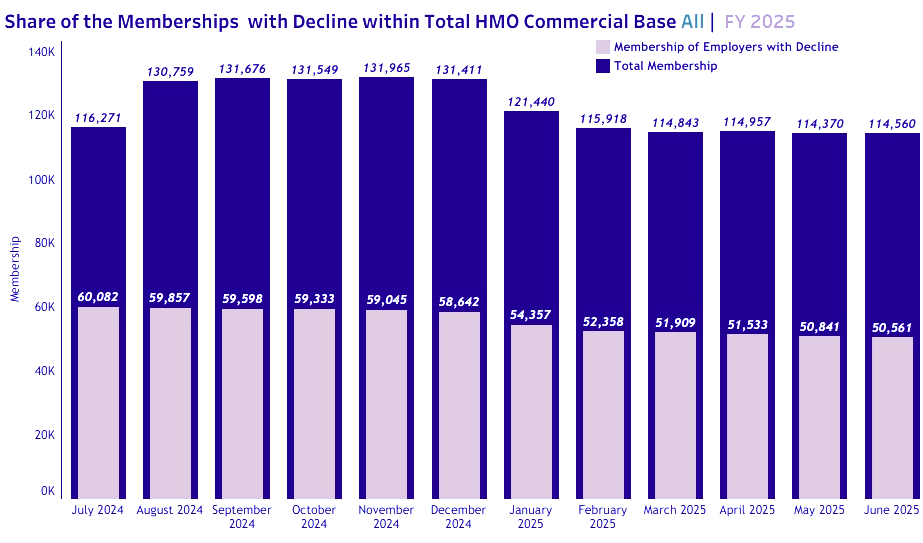
Two lines compare the total HMO commercial base with the share experiencing decline each month. The gap between them is a quick signal of stability versus vulnerability.
Figure 8. Share of declining memberships within the total HMO commercial base, FY 2025
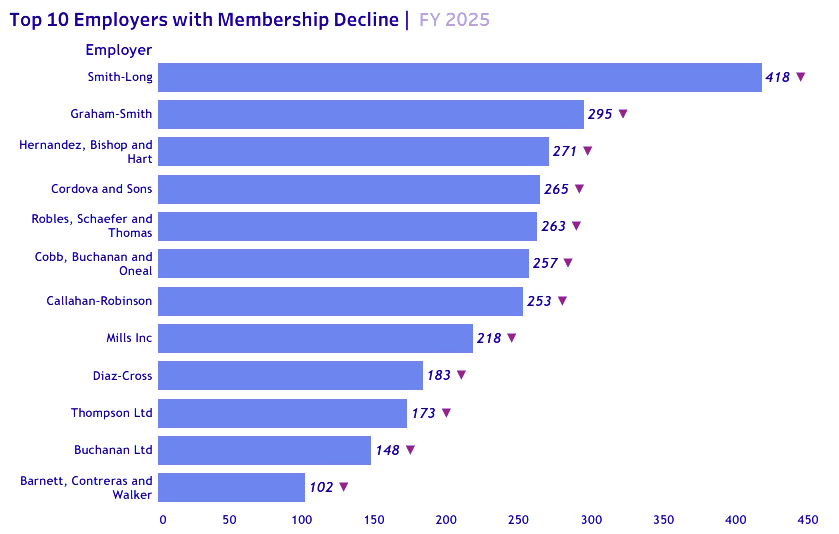
Active employers losing the most members: prime candidates for executive check-ins, benefits navigation support and targeted communications.
Figure 9. Top 10 employers with membership decline, FY 2025
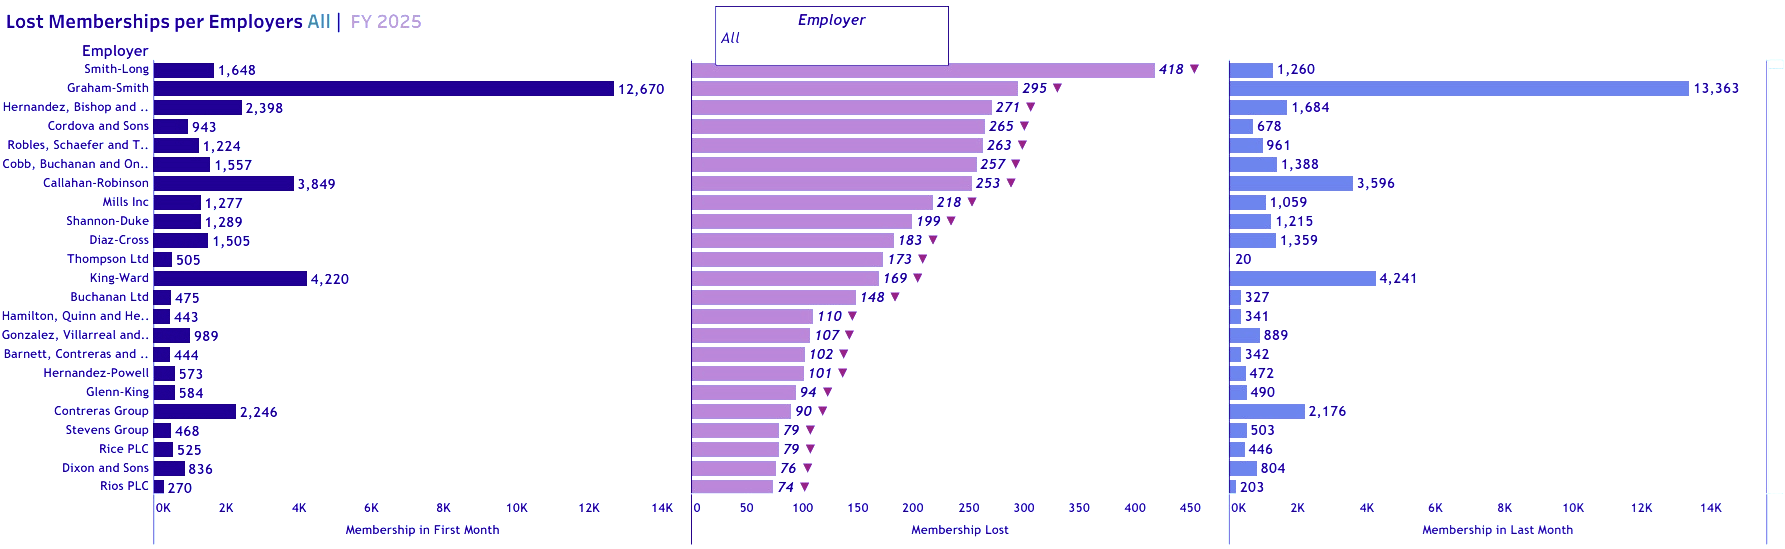
For each top declining employer, membership in the first month, the amount lost and the last-month membership. It separates reversible dips from structural declines.
Figure 10. Lost memberships per declining employer: first month, loss, last month, FY 2025
Within the declining cohort, the product codes most associated with member loss are the starting point for benefit tweaks and targeted education.
What the data tells us
Scope of churn: 1,375 employers churned in FY 2025 (24.5% of the employer base), taking 4,082 memberships (-3.5%).
Declining cohort: 1,299 employers experienced net declines (26.3%), for a total loss of 9,521 memberships (-8.2%).
Product & plan concentration: Churn and decline cluster around specific product codes and health plans, these pockets should shape retention plays.
Source signal: Broker/partner sources contribute unevenly to churn, the largest source alone accounts for thousands of lost members.
Likely root causes and recommended actions
Benefit fit & education: Concentration in certain product codes suggests mismatched coverage or poor understanding: deploy benefit navigators and clearer plan guides.
Service experience: Spike months often coincide with access or billing friction: introduce rapid-response squads to resolve issues for at-risk employers.
Source quality: Where a source over-indexes on churn, tighten partner enablement, QA, and joint account planning.
Renewal timing: Use the declining-cohort list to stage executive check-ins 60: 90 days pre-renewal, prioritizing top membership impact.
Business impact
By separating full churn from early declines and adding plan, product and source context, leaders can intervene earlier and more precisely. That improves employer retention, protects member continuity and stabilises clinic utilisation across locations.
Conclusion
Churn is inevitable, but in many cases preventable. With a shared dashboard and targeted playbooks, this multi-location healthcare facility can turn monthly insights into timely save-actions, keeping more employers engaged and more members covered.
Have churn data of your own?
We build the same dashboards and playbooks for healthcare providers, manufacturers and supply-chain teams. See how the Analytics Co-Pilot for Healthcare works, or talk to us about your data.